SDV Performance SaaS Platform
SDV Performance platform is a cloud platform that allows you to create a digital representation of the computing resources available in your vehicle, and to analyze and optimize the performance of your software on different scenarios of applications.
With SDV Performance platform, you can:
estimate the performance of your software on a multitude of hardware architectures, without re-compiling your software, skipping the integration phase and without any hardware resource
get performance insights and optimization suggestions, without actually executing on the physical hardware
analyze the interactions of different software components to monitor your resources and timing requirements
identify timing issues months before, saving time and resources
User types
The platform is engineered to support three categories of users:
Admin
Normal
Guest
Admin and Normal users are a category of users that belong to the same organization. The main difference between the two, is that Admin users can see, and operate on the Organization Settings, with details on the current active license and other sensitive information, and are responsible to invite/remove active users from the platform. Admin are by default assigned to each created project, and will see all the projects in homepage.
Guest user category is specific for collaborators that operate outside the organization. An example use for this category is for software providers, that are not willing to share the source code of the applications with the organization. With this category of user, they have the possibility to generate HPROF files on their local machine, and upload it to a specific project in the platform, without sharing the source code of the appplication. In this way:
users of the organization can have a complete view on the performance of the software
guest users can monitor the performance of the software that are developing for the customer
The view for this category of users is limited to the performance reports, but actions (like delete) can be taken only on the performance reports originated from HPROF files uploaded by the guest user.
Organization Settings
From this section, it is possible to monitor information regarding:
Status of Licenses
Active Users under the organization
Active projects with details on assigned users for each project.
The access to this page is limited to Admin users, that have also the functionality to add/remove new users to the organization.
Settings
This section allows each user to see and modify details and configurations linked with its account. From here, it is also possible to generate the REST api token, to be used to:
interact with the platform using the REST apis
validate licenses with products linked to Huxelerate Platform
Note
The token allows authentication to your account without your username and password. Misuse or loss of the token, may open your personal account to a third party, that could perform operations on your behalf. To this end, we suggest to keep the token safely stored, and generate tokens with a defined expiration date.
Support Platform
For any issue linked to the platform or Huxelerate utility, in this section it is possible to access to a support platform to get support.
Projects details
Each user has the possibility to create projects, and to share them with other colleagues. For each project there are two category of users:
project manager : the creator of the project - can share the project with other users, tag resources with protected tags and operate on all resources
developer : a contributor to the project - can see available analyses and create new, but cannot operate on the analyses of others
Inside a project there are three sections:
ECU Types: specify the ECUs available in your project
System Definition: Specify the hardware architecture, software components, task and runnable mapping and timing requirements for the analysis
Analyses: get performance insights at runnable/function or scenario level
1. ECU Types
The virtualization of the ECU offered by Huxelerate is at the processor level. For each processor, Huxelerate develops, and offers in the platform an architectural model of the processor that can be interpreted as a digital twin of the physical processor, that operates as it physical counterpart. The model allows to get multiple insight on your software on a target architecture from a performance point of view.
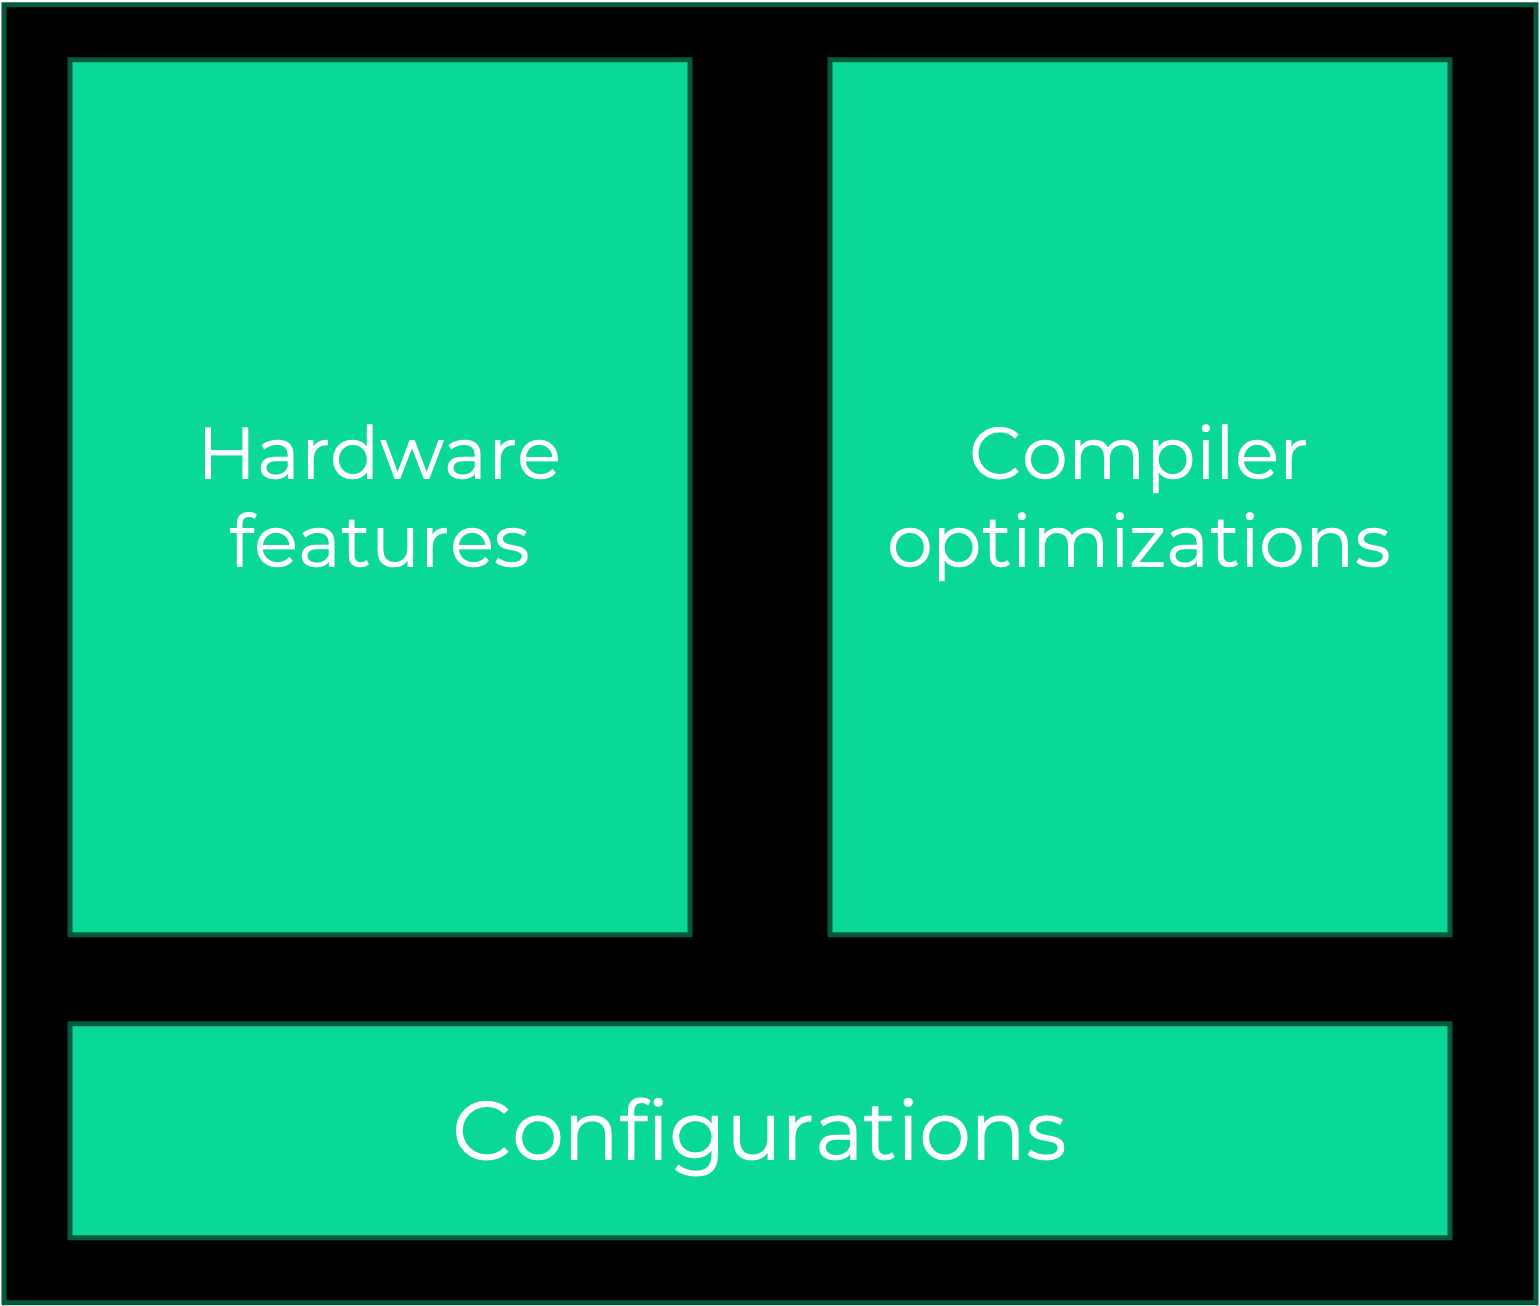
The model offered in the platform is the result of two ingredients:
hardware features (such as number and type of processing elements available on the target architecture, or the bandwidth/latency of the available memories)
compiler optimizations (such as the compilation strategy)
Each model is configurable, so that it is possible to test the architecture under different circumstances (i.e. cache on/cache off). The main configuration of the model involves:
Clock frequency of the components
Memories (i.e. cache enabled in specific segments, prefetchers, etc…)
Compilation flags
Compilator used
The choice of a specific architectural model and its configuration, defines an ECU Type. In this section, it is possible to instantiate multiple ECU Types, that will be used for the analysis in the project. For an analysis to be performed on a target architecture, it is necessary that the relative ECU type is defined in this section. Having multiple ECU Types is very useful, especially when comparing the performance of a software on different targets, even if the target is the same architecture, but configured differently. Once an ECU Type has been defined in the project, it is then possible to instantiate it inside a scenario for analysis, or use it to get a performance report.
2. System Definition
System definition sections collects all the information necessary to perform a scenario analysis. A scenario is defined as a photography, real or hypotetical, of the physical system, on which we want to test the performance of the system. It is composed of:
one or more ECUs, that can be interconnected with a communication channel (network)
a definition of network data (usually defined via DBC file)
a definition of the software components available on the ECUs
a set of Timing contstraints to be checked during the simulation
a Task and runnable mapping on the cores of the available ECUs
It is possible to define multiple scenarios, and copy the definition of the system from another scenario, so that it is possible to track the evolution of the system
3. Analyses
There are three categories of analyses that is possible to perform, depending on the license available:
Runnable Performance: analyze the performance of your software at the runnable level. Obtain current and attainable execution time, functions breakdown, CPU usage on a multitude of hardware processors and optimization suggestions
Network Analysis: analyze network load and response time in isolation, identify scenarios that may originate high network load
Resource Analysis: get current ECU usage of a set of software running on your ECU
Timing Analysis: simulate the behavior of your software on a set of target ECUs connected by a network, to monitor resource usage, constraints violation and software interactions.